Atlanta Regional Housing Forum

Source: Atlanta Studies News
URL: Atlanta Regional Housing Forum

Atlanta Regional Housing Forum: Atlanta’s Affordable Housing Preservation Challenge
Date: June 7, 2017
Time: 9:30 – 11:45 am
Location: St. Luke’s Episcopal Church at 435 Peachtree St NE
RSVP: https://events.r20.constantcontact.com/register/eventReg?oeidk=a07ee69kajz845e4fdf&oseq=&c=&ch=

Housing affordability challenges are acutely felt amongst renters in the Atlanta region. Addressing the need for affordable housing across the region will require a concerted, multifaceted strategy that increases the supply of homes available to households across the income spectrum and preserves affordability where it currently exists. Preservation of the existing affordable housing stock is a particularly urgent challenge. From 2010–2014, there was a 17 percent reduction in the number…
Read More: Atlanta Regional Housing Forum

Summer 2017 Meetup

Source: Atlanta Studies News
URL: Summer 2017 Meetup
Summer 2017 Atlanta Studies Meetup:  The Past, Present, and Future of Public and Affordable Housing in Atlanta
Date: Tuesday, May 30  Time: 7:00-9:00pm
Location: Manuel’s Tavern
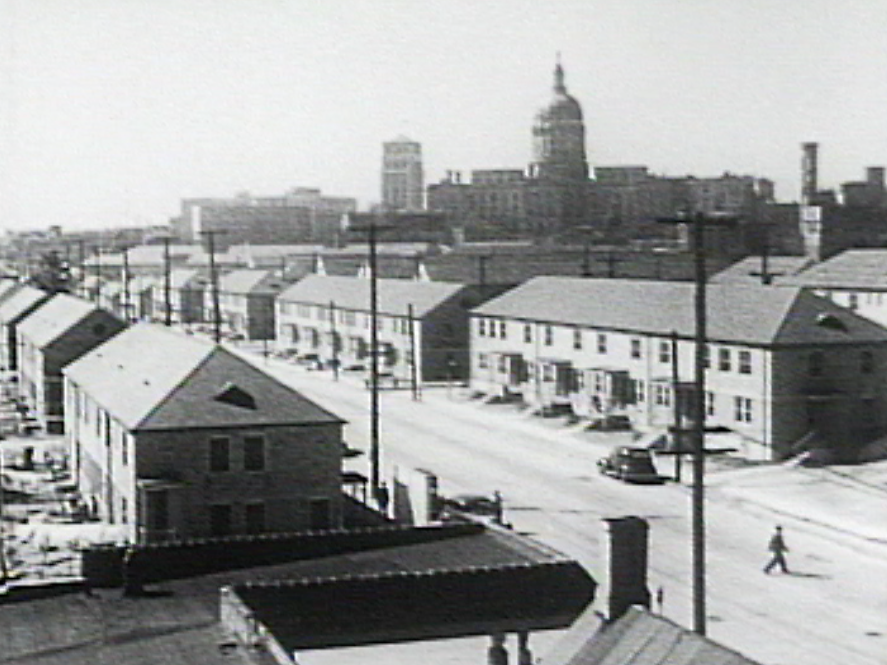
Join us on Tuesday, May 30th at Manuel’s Tavern from 7 to 9 for the summer Atlanta Studies Meetup. These quarterly meetings showcase Atlanta-focused projects and bring together a group of folks interested in our city. We will provide a few snacks. Buy your own drinks. For this event, we will show a couple of short films from the Atlanta Housing Authority from 1940 about the construction of Atlanta’s public housing.…
Read More: Summer 2017 Meetup

On Jane Jacobs’ Centennial

Title: On Jane Jacobs’ Centennial
Source: Events – Atlanta Studies
URL: https://www.atlantastudies.org/2016/05/04/on-jane-jacobs-centennial/

On Jane Jacobs’ Centennial


Some of the work published here at Atlanta Studies exists, in part, because of a book published 55 years ago, Jane Jacobs’ The Death and Life of Great American Cities. Her first book remains an influential analysis of the traps hidden in post-war conventional theories about communities. She questioned what and whom the city was for—what are the responsibilities, opportunities, and sacrifices that governmental and civilian bodies may take on. She opposed the car-dependent, individually isolated, urban planning that grew after World War II—pulling cities apart at the seams and building the long thoroughfares and meticulously placed suburban landscape. In its place Jacobs called for city planning that focused on the citizens and not their cars, that endorsed mixed-use developments, parks, and sidewalks.


Resurgens seal of Atlanta


If The Death and Life of Great American Cities was Jacobs’ prescription for urban planning and urban studies, then her 2004 final book, Dark Age Ahead was her (dismal) prediction. The five pillars of North American society were crumbling—elevating the isolated individual over the community, reducing education to credentialism, mistaking economics as a substitution for a political science, confusing the needs of the population with the desires of the wealthy few, and suppressing the shared world in favor of one built by easy ideologies. Twelve years later, and ten years after death, we find ourselves in a future that is precariously balanced between the two visions. We have hoped and changed in some areas—in other, critical spaces we remain committed to ideologies rather than the flourishing of the public space. We are, ultimately, human.

There are echoes of her work throughout Atlanta’s history.  Jacobs’s battle with the Manhattan Expressway can be seen in the decades-long opposition to expressway expansions here at home—Atlanta’s fight rising to the U.S. Court of Appeals, 11th Circuit. 1 Just this Monday, the Atlanta City Council strengthened its ordinance concerning affordable housing—now all publicly subsidized developers must set aside at least 15% of their units to be leased at a cost commensurate with the income of the citizens already in those neighborhoods. Meanwhile, “Braves Country” moves from its location at the center of Atlanta’s downtown to a new stadium being built Outside the Perimeter. This new stadium requires a car; many of the on-going concerns focus on parking lots. And at the same time Clayton County has joined with MARTA, having decades before rejected it.

The patterns of loss and revival can reveal a living city, high-rise luxury apartments stretch up in Edgewood while Georgia Tech attempts a careful balance between old and new. Our parks, our mixed-use neighborhoods, and the questions of how Atlanta grows, changes, and answers to her citizens—these are what inspired and continue to fuel Atlanta Studies.

To see Jacobs’ on-going relevance and influence, join the Jane’s Walk  through Downtown Atlanta this Saturday. Join the conversation and our 4th annual Symposium on May 11. Go out and find a living piece of Atlanta.

Resurgens.

Notes   [ + ]

1. Even that level of judicious scrutiny produced a judgment that affirmed, reversed, and remanded the case brought before it.

Teaching Atlanta Digitally

Title: Teaching Atlanta Digitally
Source: Events – Atlanta Studies
URL: https://www.atlantastudies.org/2017/01/19/teaching-atlanta-digitally/

Upcoming Symposium: Teaching Atlanta Digitally 


How might digital platforms and approaches facilitate more robust local pedagogies? 

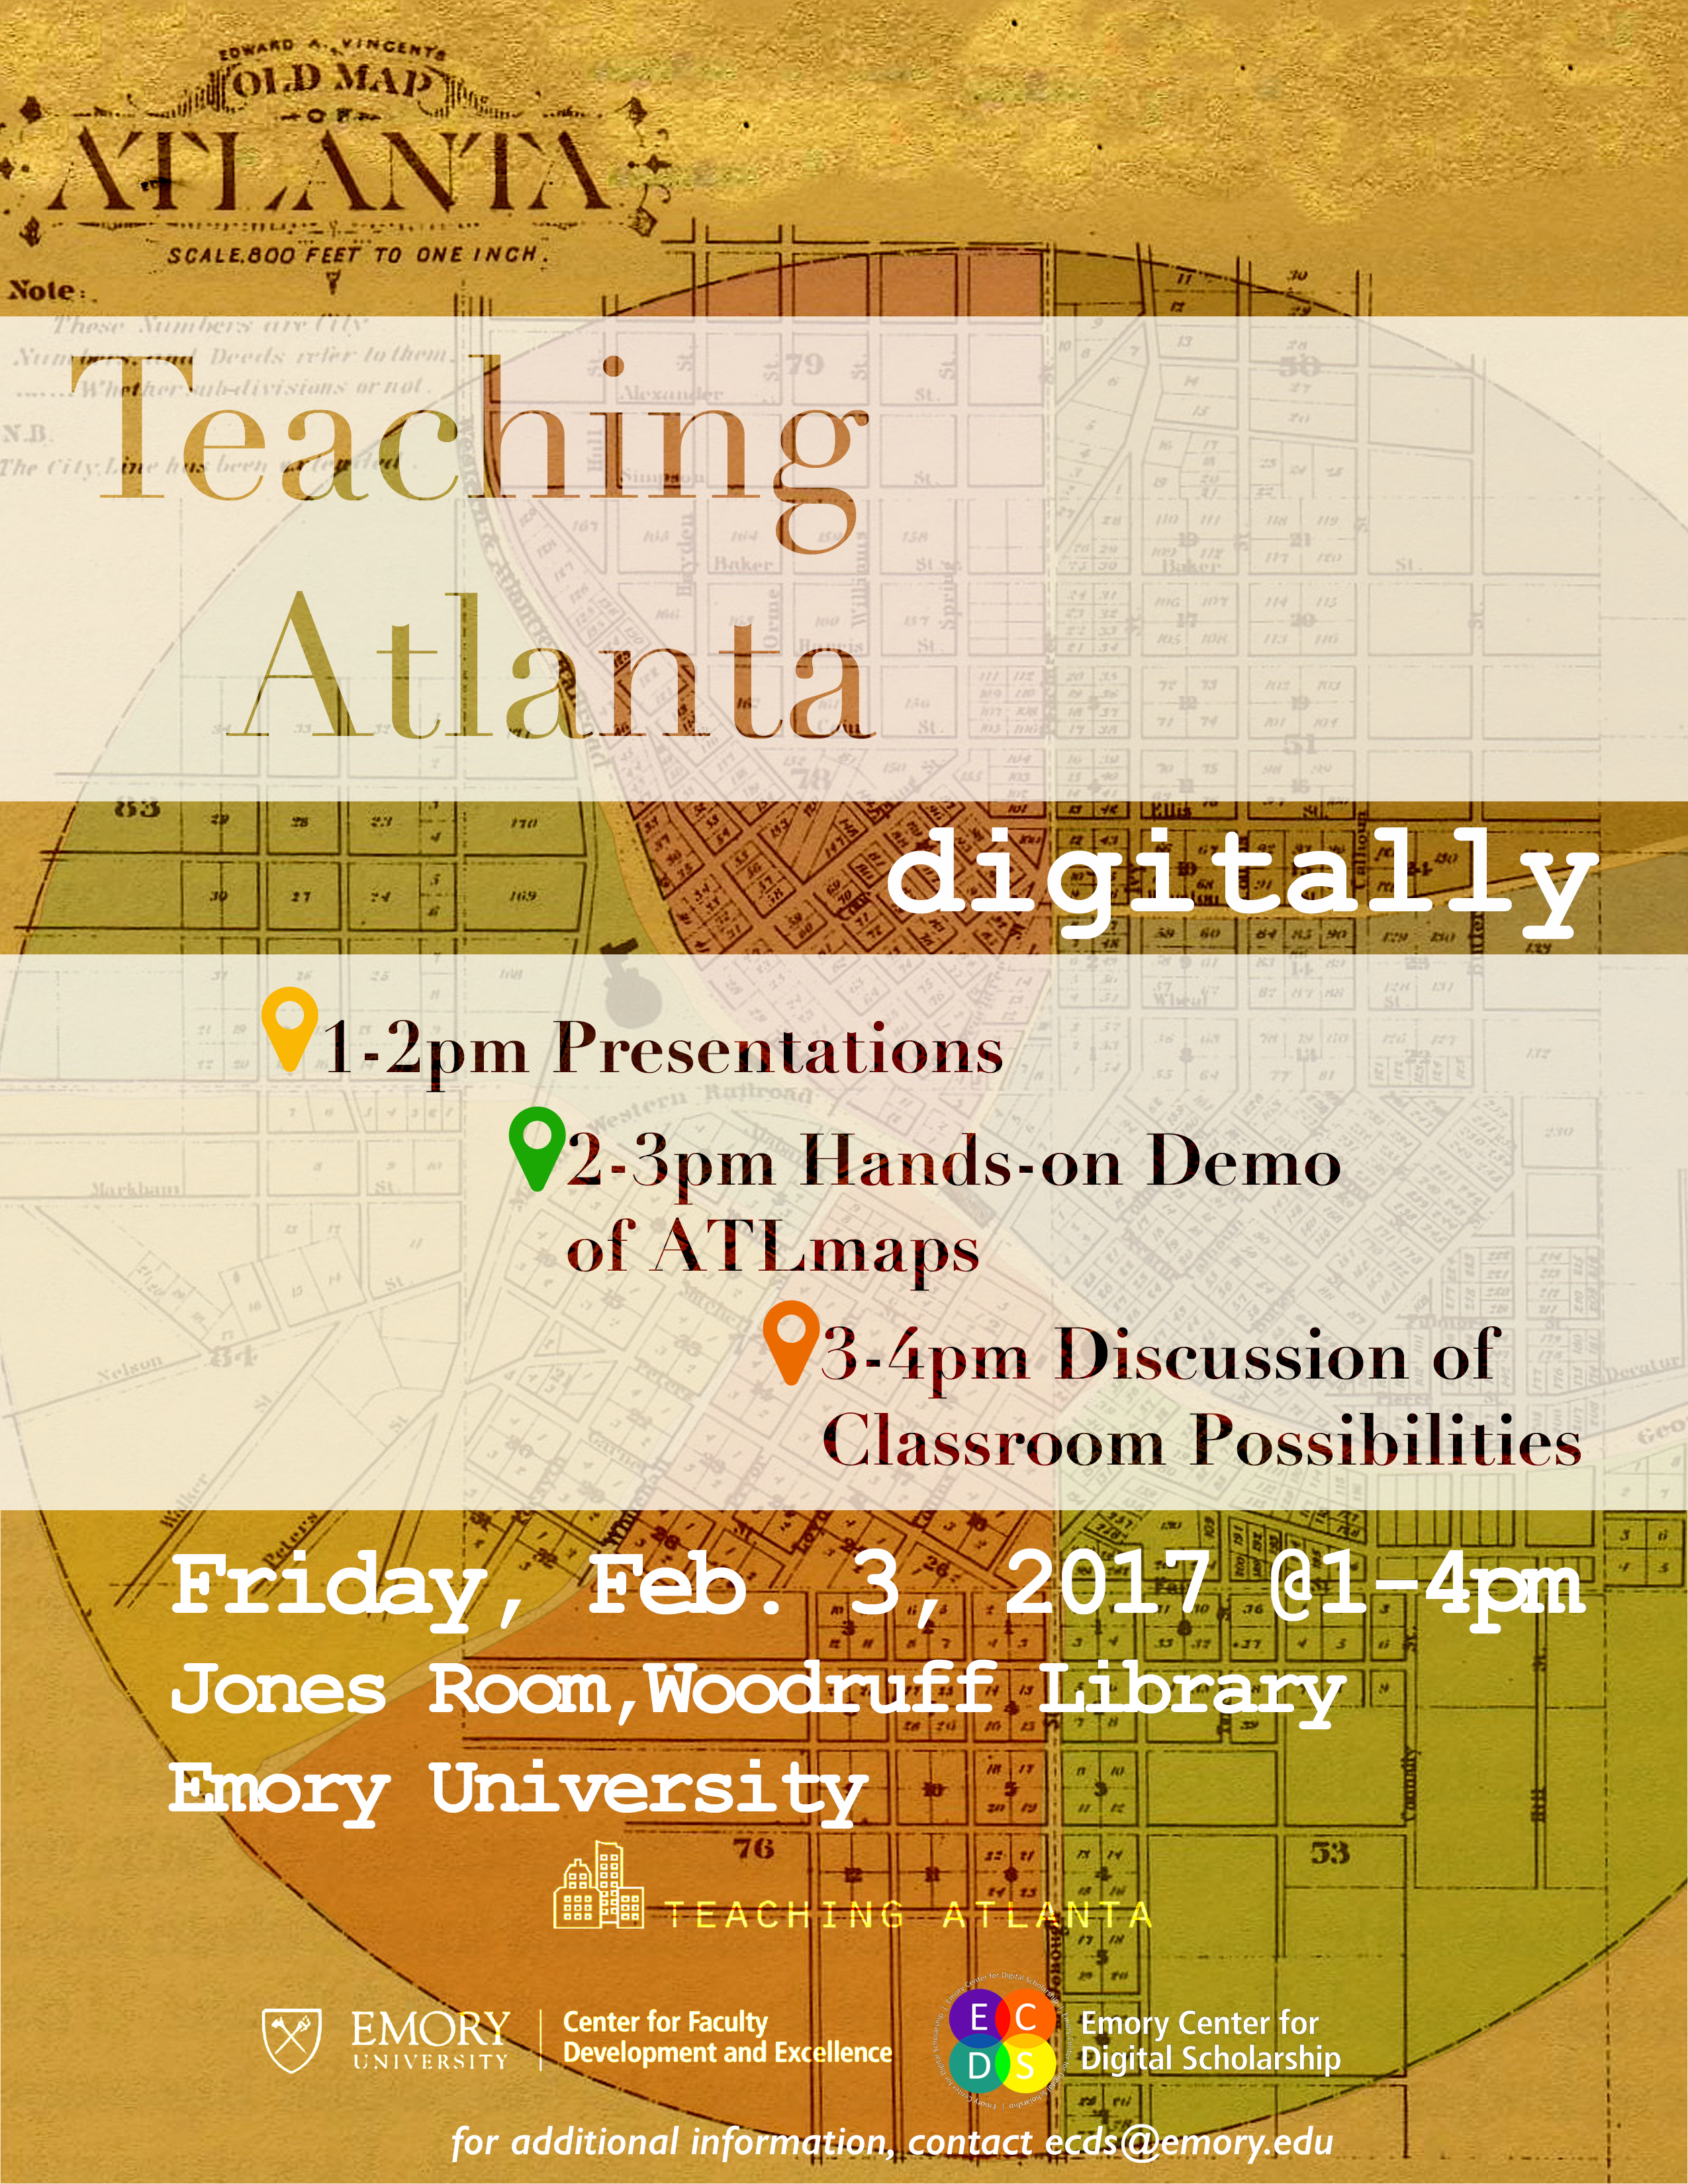
On Friday, February 3, 2017 in the Jones Room (3rd floor) of the Robert W. Woodruff Library at Emory University, the Emory Center for Digital Scholarship, in collaboration with the Emory Center for Faculty Development and Excellence and Teaching Atlanta will host a half-day symposium entitled Teaching Atlanta Digitally. This symposium is free and open to the public and will examine exactly these issues at the intersection of local and digital pedagogies in the context of our great city of Atlanta.

This symposium will be modular in format (allowing folks to come to as much or little of the event as they are able) and will be composed of three distinct portions. The first hour (1–2 pm) will be comprised of a set of presentations about digital and local pedagogical approaches, including discussions of the Teaching Atlanta network as well as concrete examples of local and digital pedagogies from David Morgen of Emory and Ruth C. Yow and Sarah O’Brien of Georgia Tech. In the second hour (2–3 pm) we will offer a hands-on opportunity to explore the exciting ATLmaps platform as a potential classroom resource with one of the developers of the platform, Brennan Collins of Georgia State University, leading the session. Finally, the symposium will conclude with a facilitated discussion (3–4 pm) in which we will collaboratively reflect on the concrete ways we might all bring such digital and local approaches into our own classrooms.

We hope you can join us for what should be a great event! For additional information, including any accessibility concerns, please contact ecds@emory.edu


Atlanta Studies Winter 2017 Meetup

Title: Atlanta Studies Winter 2017 Meetup
Source: Events – Atlanta Studies
URL: https://www.atlantastudies.org/2017/01/24/atlanta-studies-winter-2017-meetup/

Atlanta Studies Winter 2017 Meetup


Date: February 6th, 2017

Time: 7pm

Location: Manuel’s Tavern, 602 N. Highland Ave.

Come see our progress on the Unpacking Manuel’s project and tell your stories about the Tavern. Manuel’s is a living archive of the history, culture, and politics of Atlanta. Over the next couple of years we will be collecting community memories and student projects to curate digital visualizations of the establishment before the renovation.

At the event, you will be able to try on an oculus rift so you can check out our Virtual Reality demo. We will have some google cardboards with us so you can experience the 360 video tour of the renovation on your phone. You can also see the high-resolution gigapan images of the Tavern’s walls we have completed.

Know something about the Tavern’s history or one of the artifacts on the wall? Have a memory about the bar you want to share? We will have several stations to record your stories.

The Plan:

7:00 – Grab some snacks (we will provide a few) and order a drink (that’s on you)
7:15 – A quick presentation about the project and future plans
7:45 – Explore the demos and share your stories

“Let’s Go to Work!”: The Spread of Chicago Steppin in Atlanta

Title: “Let’s Go to Work!”: The Spread of Chicago Steppin in Atlanta
Source: Events – Atlanta Studies
URL: https://www.atlantastudies.org/2017/02/07/lets-go-to-work-the-spread-of-chicago-steppin-in-atlanta/

“Let’s Go to Work!”: The Spread of Chicago Steppin in Atlanta

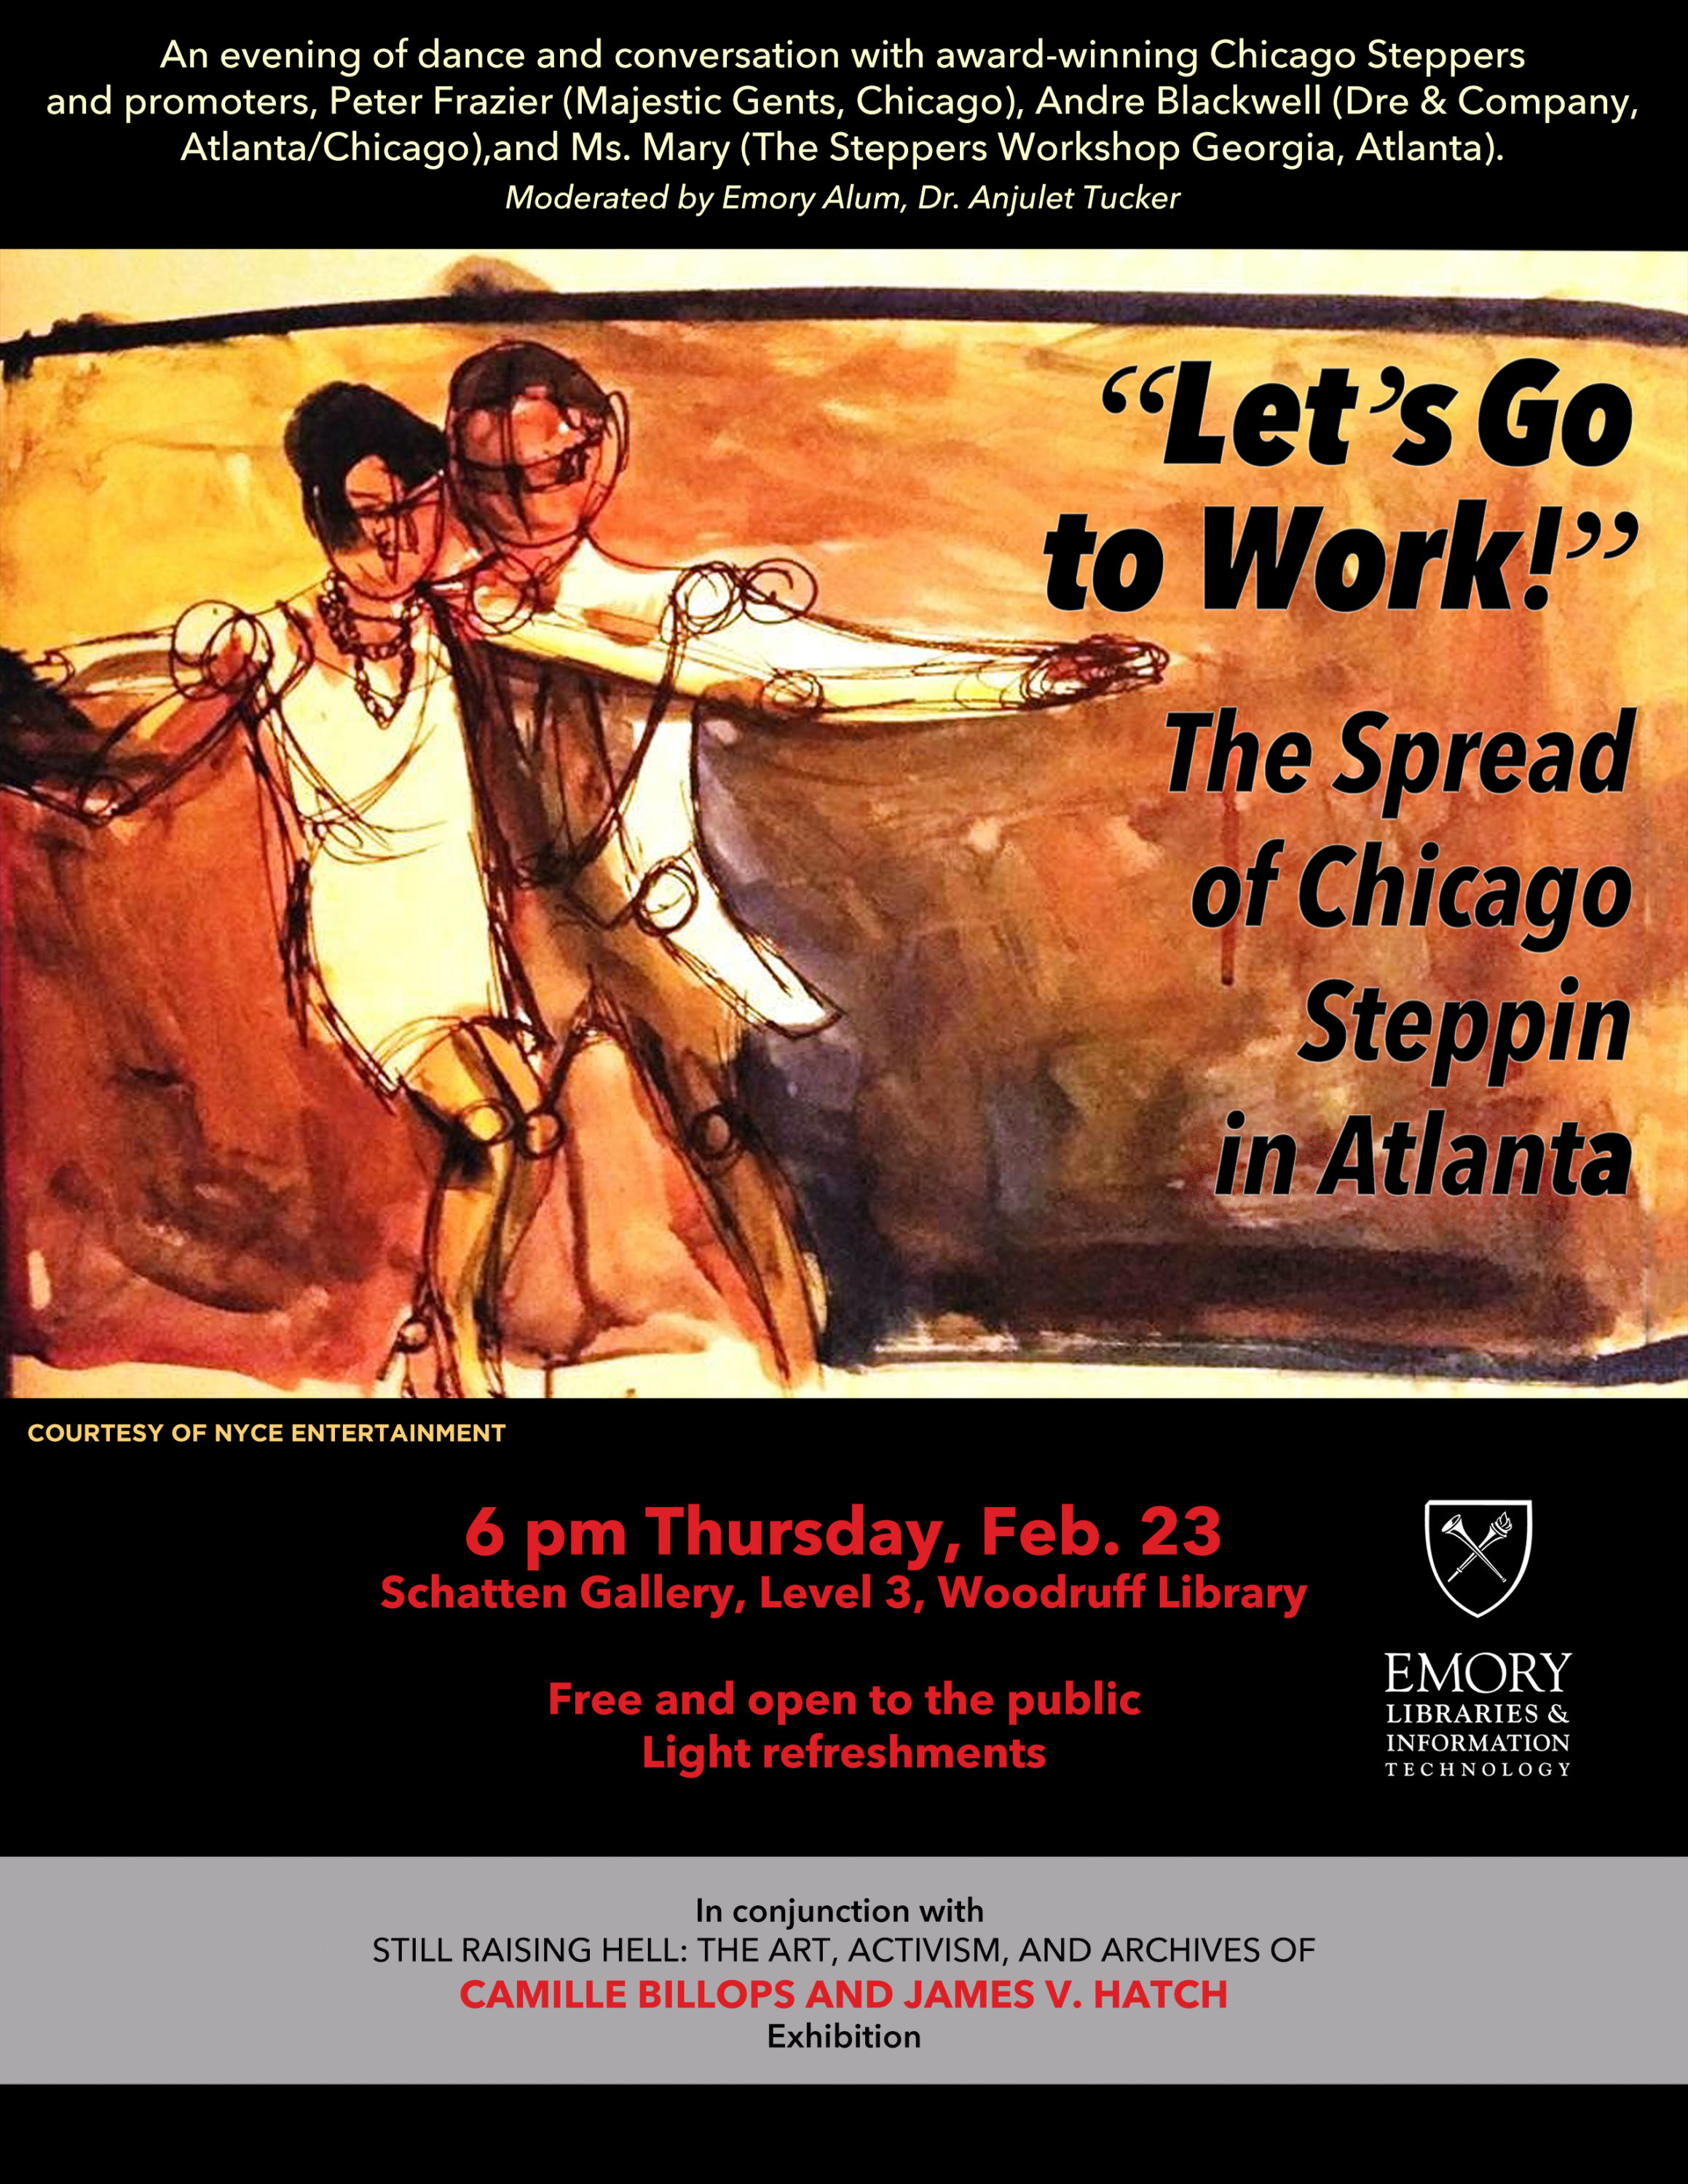
On Thursday, February 23, at 6pm, Emory University’s Stuart A. Rose Manuscript, Archives, and Rare Book Library will host an evening of dance and conversation in the Schatten Gallery on the third floor of Emory’s Woodruff Library. During this event, attendees will have the opportunity to talk with award-winning steppers from Atlanta and around the country. Steppin is a dance predominantly practiced by African Americans from Chicago that over the years has evolved and spread across the country and world. The discussion will be moderated by cultural sociologist, stepper, and Emory alum Anjulet Tucker, who will share insights from her research on the cultural exchange between steppers in Chicago and Atlanta. This event is part of a series curated to complement the ongoing Rose Library exhibition “Still Raising Hell: The Art, Activism, and Archives of Camille Billops and James V. Hatch.” 


Program and Registration Information for the 2017 Atlanta Studies Symposium

Title: Program and Registration Information for the 2017 Atlanta Studies Symposium
Source: Events – Atlanta Studies
URL: https://www.atlantastudies.org/2017/04/12/program-and-registration-information-for-the-2017-atlanta-studies-symposium/

Program and Registration Information for the 2017 Atlanta Studies Symposium

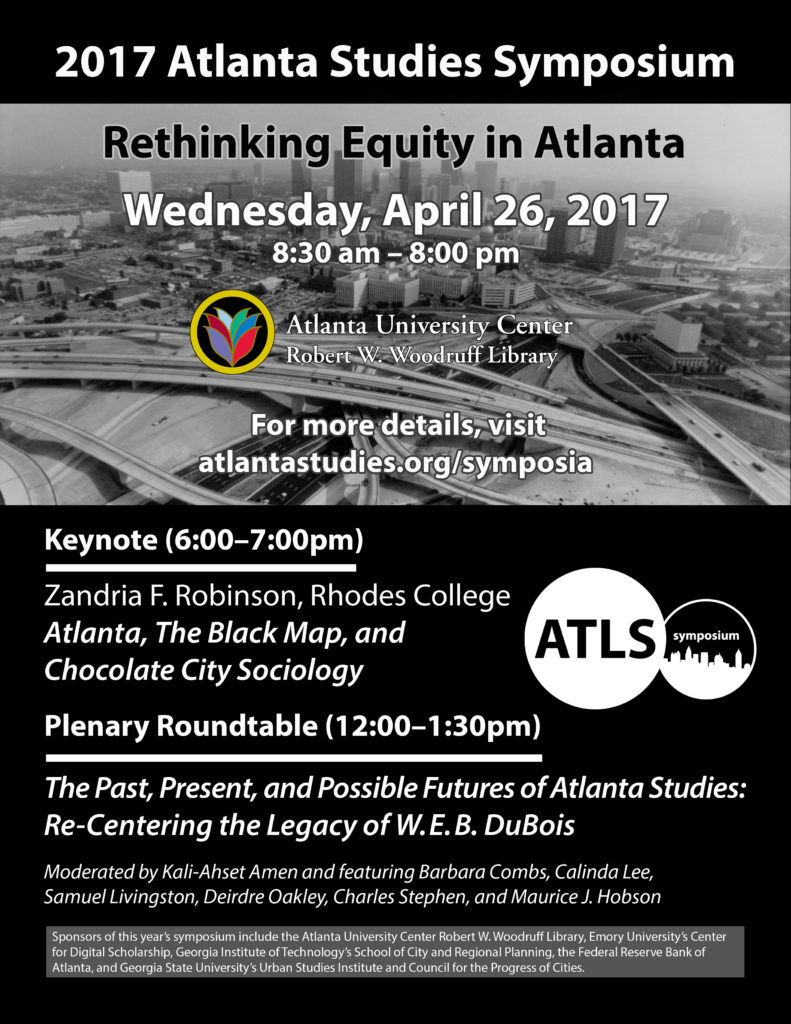
On Wednesday, April 26 the fifth annual Atlanta Studies Symposium, entitled “Rethinking Equity in Atlanta” will be taking place at the Robert W. Woodruff Library of the Atlanta University Center and we hope you can join us for what looks to be an exciting day of discussions.

In addition to five sessions of concurrent panels covering a wide array of topics, the symposium will feature a catered plenary roundtable at noon entitled “The Past, Present, and Possible Futures of Atlanta Studies: Re-Centering the Legacy of W.E.B. DuBois.” 

The symposium will conclude with a keynote at 6pm from Prof. Zandria F. Robinson of Rhodes College, entitled “Atlanta, The Black Map, and Chocolate City Sociology” which will be followed by a reception.  

The full program is now available here: Atlanta Studies Symposium 2017 Program – Print

Please register at the following link if you plan to attend (including if you are a presenter or moderator): https://goo.gl/forms/1hv1G8Jxqq4VaMM33


Upcoming Symposium: Measuring the Dream

Title: Upcoming Symposium: Measuring the Dream
Source: Events – Atlanta Studies
URL: https://www.atlantastudies.org/2017/04/27/upcoming-symposium-measuring-the-dream/

Upcoming Symposium:

Measuring the Dream: From Brown to Black Lives Matter

On Wednesday, May 10 at the National Center for Civil and Human Rights, the Georgia Institute of Technology College of Design and Serve-Learn-Sustain Program, the Georgia State University Andrew Young School of Policy Studies, and the American Civil Liberties Union Georgia will host a symposium entitled “Measuring the Dream: From Brown to Black Lives Matter” from 8:30 am – 5:00 pm. 

The Measuring the Dream Symposium looks critically at available data and explores issues of equity in the areas of education, health, and criminal justice.

Join scholars, professionals, community leaders, and students as they discuss historical trends, key events, and suggested new directions for action in addressing disparities and realizing the American Dream for all communities. 

For more information on speakers, agenda, and registration, visit: https://www.measuringthedream.com/

Topics in PLMA interface

Title: Topics in PLMA interface
Source: Blog – DH Lab
URL: http://dhlab.lmc.gatech.edu/uncategorized/topics-in-plma-interface/

To start thinking about how we might design an interface to act with topic modeling results, it’s worth looking at existing interfaces and what they do well or don’t do well.

This interface by Andrew Goldstone allows for browsing topic models of articles from PMLA, the journal of the Modern Language Association of America. The model and code can be used for other sets of text – this is just an example.

The interface has multiple views and ways to explore the model – something can be learned from each of these. The site as a whole, and the navigation between the views, is slightly confusing and conceptually basic, but since it is described as an alpha version, I won’t dwell on those issues. The bulk of the content is in the “Overview” section.

Overview: Grid

screen-shot-2017-01-24-at-9-42-24-pm

A simple display of each topic as a circle, with the words sized corresponding to its weight within the topic. The topic bubbles are arranged in order of the number of the topic. Clicking a bubble leads to the corresponding topic page, which is not part of the “Overview” section.”

Strengths:

  • Easily apparent each bubble represents a topic
  • Movement from overview of topics to one specific topic is clear

Limitations:

  • Perhaps a technical flaw, the thickness of the border on each bubble varies but doesn’t seem to actually represent anything.
  • Six words are in each bubble, however there are many more “top words” within the topic model. This may or may not be a “problem” but it is something to be aware of.
  • Besides word size within each bubble, there are little other visual cues to guide the experience…which is why there are more views…

Overview: Scaled

screen-shot-2017-01-24-at-9-54-13-pm

The topics are spatially arranged by similarity. This uses principal coordinates analysis, which I mentioned in the previous blog post.

Strengths:

  • Provides additional information – the similarity
  • Provides interaction to discern overlapping topic bubbles
  • Useful for discovery

Limitations:

  • How it is arranged is not immediately clear – at least to a novice user, one less familiar with topic modeling
  • Requires additional interaction to zoom in to areas with overlapping topic bubbles
  • Difficult to locate topic within scale

Overview: List

screen-shot-2017-01-24-at-9-45-16-pm

A table format allows for comparison of more information – adding a small “over time” illustration and proportion of words in the corpus assigned to the topic.

Strengths:

  • More information viewable at once

Limitations:

  • The author mentions in the documentation that the bar for the proportion of words can be misleading because “the highest-proportion topics are often the least interesting parts of the model — agglomerations of very common words without a clear thematic content.”
  • The y-axes of the mini bar charts “over time” are not all the same scale
  • Requires scrolling, so it can’t all be viewed at once

Overview: Stacked

screen-shot-2017-01-24-at-9-45-21-pm

This view evokes D3 the most – varied by color, each topic model is stacked on top of each other and shown as the appearance increases or decreases over time.

Strengths:

  • Shows trends of each topic model over time, all at once

Limitations:

  • Topic models with less appearances are harder to distinguish without interaction

Topic

screen-shot-2017-01-24-at-9-42-35-pm

Each topic has its own view, including top words and their weight, proportion over time, and top documents.

Strengths:

  • Clicking on the bar in the timeline limits documents. Great use of drilling down. Although, it would be nice to be able to select multiple at a time. 

Limitations:

  • Clicking on the document or the word opens up the document or word interface, leaving the context of the topic itself behind. Expansion within topic is alternative option.

Document

screen-shot-2017-01-25-at-10-32-25-am

View shows title and topics by proportion. To reach a document, it must be clicked on from the bibliography page or from a topic page. If topics are the priority, this makes sense – otherwise it might be interesting to also have a document view (beyond standard bibliography).

Word

screen-shot-2017-01-25-at-10-32-15-am

View shows topics in which the word occurs. Similarly to document, it must be reached by a list of all words (for documents, bibliography) or a topic page. If the word only appears in one topic, it’s surprising when the view changes to show a different word among many topics. The animation helps with these transitions.

General considerations

  • Time to load – with a large dataset, lag time can be frustrating for the user and even make interaction impossible
  • Difficult to follow a topic throughout the different views – As the screenshots that I took show, I looked at Topic 18 throughout my exploration. When on a topic page, there is no way to see the topic simultaneously in any of the Overview views. For example, I would like to return to the Overview and perhaps see Topic 18 highlighted in the Scale or Table view. However, navigating between words and documents, and discovering other topics in the document, is likely helpful to a humanities scholar.

UX Questions 

From exploring this interface, I’ve come up with a list of questions to consider in future designs. Many of them are classic information visualization questions, with no one answer.

  1. How many words of a topic should be displayed at once to best indicate the topic? Generally, how much information should be shown at once?
  2. How do we design for exploration and discovery of information? Rather than a search like a database query?
  3.  When is it appropriate to change the presentation of data, e.g. axis variables?
  4. When drilling down to a detail, how much context should be shown?
  5. How much visualization beyond the topic itself is necessary, e.g. do we also want to visualize all of the documents where each document is a variable?
  6. What should be sacrificed for quicker load times?


There are a lot of things to be learned from these different views. Great documentation, thought process, explanation of design decisions by author here: http://agoldst.github.io/dfr-browser/

InPhO Topic Explorer

Title: InPhO Topic Explorer
Source: Blog – DH Lab
URL: http://dhlab.lmc.gatech.edu/uncategorized/inpho-topic-explorer/

This interface works in terms of visualizing a topic modeling and understanding context. However, less effort has gone into the visual and interaction design than in the last interface discussed, which makes for a steeper learning curve.

Starting Interface

screen-shot-2017-01-26-at-8-30-12-am

The interface begins as a drop-down menu within the homepage, which also includes documentation on the code and how to download it. I already know that in our design, we’re  focusing attention on the interface and exploration of the topic model results. We will probably want the documentation to be separate from the interface, like the interface in the previous blog post.

Strengths and Limitations

screen-shot-2017-01-26-at-8-30-34-am

Two inputs: The simplicity of the starting interface is helpful. It’s clear that I need to choose a corpus of text – so I chose “Letters of Thomas Jefferson.” At first glance, it appears to require some knowledge of the documents already in the “Type to match document titles…” bar. What if I don’t know any? Clicking on the “random” button, which is also the “shuffle” button in music apps like Spotify, does nothing at first. It actually does, it just takes a little too long to load. It selects the letter “To Mr. Dumas, July 13, 1790.” I can also just click the Visualize button without any document in the bar, although this is not clear through the interface.

screen-shot-2017-01-26-at-8-33-48-am

Visualize #: The Visualize button allows selection of 20, 40, 60, or 80 topics. I have no idea how this will affect anything, so I choose 20. It might be good to have this variation, but more indication on how it might change things for users unfamiliar with topic models might be necessary.

Main Interface

screen-shot-2017-01-26-at-8-39-34-am

Overall, it’s nice that the primary interface is more or less on one page so there is not as much need to move around between separate views that can feel disjointed. However, there are less ways to view the topic model. The main view is a horizontal bar chart, with each bar representing a document and each section of the bar representing a topic.

Strengths and Limitations

screen-shot-2017-01-26-at-8-45-31-amscreen-shot-2017-01-26-at-8-42-36-am

Color: I’m not sure if this was just unlucky color assignment, but the top two topics that appear the most in the focal document were assigned the same color variable, making it nearly impossible to distinguish between the two. Typically, when visualizing categorical data (here, the categories are the topics), people can only distinguish about 8 colors – after that, it becomes much more difficult. Here, for the 20 topics, 9 colors are being used, but more than one is assigned to  multiple topics, which defeats the purpose of distinguishing by color.

Connections: The interaction of hovering over the topics in the document and showing the name of the topic in the key is helpful.

Scale: Someone familiar with topic modeling might understand the “Similarity to” scale at the top, but others that are not might want a quick note of what it means.

Checkbox features: “Normalize topic bars” makes each part of the bar for the document in proportion to the collection as a whole, rather than the individual document. This is definitely a useful feature for context, and using a checkbox makes it easy. Similarly, the “Alphabetical sort” option is a useful, and simple, feature.

Topic model #: Changing the topic model quantity is helpful, using the little dropdown menu next to the dropdown menu for the focal document. The loading time is quick, a loading status bar is provided to show it is working, and then there is animation so the transition isn’t jarring. However, there is also a bar on the far left, where you can click on the same numbers (20, 40, 60, 80) and change to the topic model, but then it transitions to a blank slate. The bar on the left likely indicates a “home” or “reset” which is why this happens, but I’m not sure what it adds or what the use cases would be.

Reordering: Clicking on a segment sorts the documents by “Top Documents for Topic #”. This is useful for exploring context. However, the “focal document” then becomes lost in the reordered list. There is no highlight or visual call to attention on the document listed at the top, which is what we started with. This would probably be a useful feature to have, in order to trace a document throughout explorations of various topics.

Randomizing: Randomizing the document brings up new titles, but still requires the press of the Enter button to display the new data. Having a random button allows for playful discovery, so it’s nice to have.

Undo: The browser’s back button doesn’t always take you to the exact last place in the model viewing, so having an “undo” button of sorts would provide for handling of user mistakes or simply additional navigation.